
Yes, the Pokémon card market is definitively becoming more data-driven. Over the past few years, professional grading submissions, real-time pricing platforms, and sophisticated analytics tools have transformed what was once a hobby market into one governed by metrics, benchmarks, and quantifiable performance data. This shift reflects broader maturation in the trading card industry, where collectors and investors now rely on standardized valuations, historical price tracking, and algorithmic market indicators in much the same way they would for traditional financial assets. The numbers underscore this transformation.
More than 20 million cards were professionally graded in 2024—a 16% increase from 2023—with PSA alone processing 15.34 million submissions. These grading volumes didn’t exist five years ago at this scale. Simultaneously, dedicated analytics platforms like PokemonPriceTracker, PokeScope, and PokeDATA emerged to aggregate real-time prices from eBay, TCGPlayer, CardMarket, and auction houses, giving collectors the same price discovery tools that stock market participants use. What this means in practical terms: a serious collector today can check PokemonPriceTracker and see the exact price paid for a specific Charizard holographic card at auction last week, compare it to its PSA grading average, and make decisions based on historical ROI trends. That level of transparency and data accessibility simply didn’t exist in previous Pokémon card cycles.
Table of Contents
- How Real-Time Pricing Platforms Are Reshaping Pokémon Card Valuation
- The Rise of Grading as a Data Point and Market Driver
- Benchmarking and Index Tracking in Pokémon Cards
- How Collectors Can Leverage Data Tools Without Getting Trapped by Them
- The Data Reliability Question and Sampling Bias in Market Analysis
- Sealed Product and Box Lot Tracking—The Newest Data Frontier
- The Market’s Future and the Role of Data Infrastructure
- Conclusion
How Real-Time Pricing Platforms Are Reshaping Pokémon Card Valuation
The emergence of specialized analytics platforms has fundamentally changed how pokémon card values are determined. Historically, collectors relied on guides like Beckett Grading or incomplete online marketplaces. Now, platforms like PokemonPriceTracker track 50,000+ cards with real-time market data and daily movers updated directly from TCGPlayer, while PokeScope combines data from TCGPlayer, CardMarket, eBay completed sales, and auction houses with updates refreshing every hour. These aren’t estimates—they’re live aggregations of actual transactions across multiple markets. The practical effect is price convergence. When a PSA 10 first edition Blastoise sold at auction for $8,500 in January 2026, that data point immediately cascaded through these tracking systems.
Sellers worldwide adjusted their asking prices within hours, not weeks. The efficiency gain cuts both ways: collectors get better price discovery, but the days of finding undervalued gems on secondhand markets are largely gone. Everyone is looking at the same datasets. This data-driven transparency also revealed just how strong market momentum has been. Since March 2025, Pokémon card values have risen over 145%, with buyers spending $450 million on cards in January 2026 alone. That figure—$450 million in a single month—is something you can only calculate when you have real-time transactional data flowing through centralized platforms. It’s a metric that didn’t exist five years ago.

The Rise of Grading as a Data Point and Market Driver
Professional card grading has become the foundation of the data-driven market. When a card receives a PSA or Beckett grade, it’s assigned a numerical score (1-10) that becomes a standardized identifier. This standardization allows apples-to-apples comparisons: you can pull historical data on every PSA 8 1999 Base Set Charizard sold in the past 24 months and calculate average price, volatility, and trend direction. Without grading, that analysis would be impossible. The scale of grading activity speaks to the shift. 20 million cards graded in 2024 created a massive database of transaction history linked to specific card grades and conditions. PSA’s 15.34 million submissions represent the single largest source of standardized valuation data in the hobby.
The consequence: grading fees, wait times, and the cost of authentication have become accepted business expenses rather than nice-to-haves. Serious investors don’t deal in ungraded cards anymore because ungraded cards lack the data trail that determines fair value. However, there’s a limitation to understand: the grading process itself can introduce artificial value floors and ceilings. A card that’s a clear PSA 8 but submitted during market enthusiasm might get a 9, shifting perceived value upward. Conversely, when markets cool, the same card graded months later might receive an 8. The data trail assumes grading standards are consistent, but human subjectivity in grading can skew trend analysis over time. Additionally, higher grading volumes sometimes correlate with market tops, not bottoms—when everyone is getting cards graded, it’s often a sign that speculation is peaking.
Benchmarking and Index Tracking in Pokémon Cards
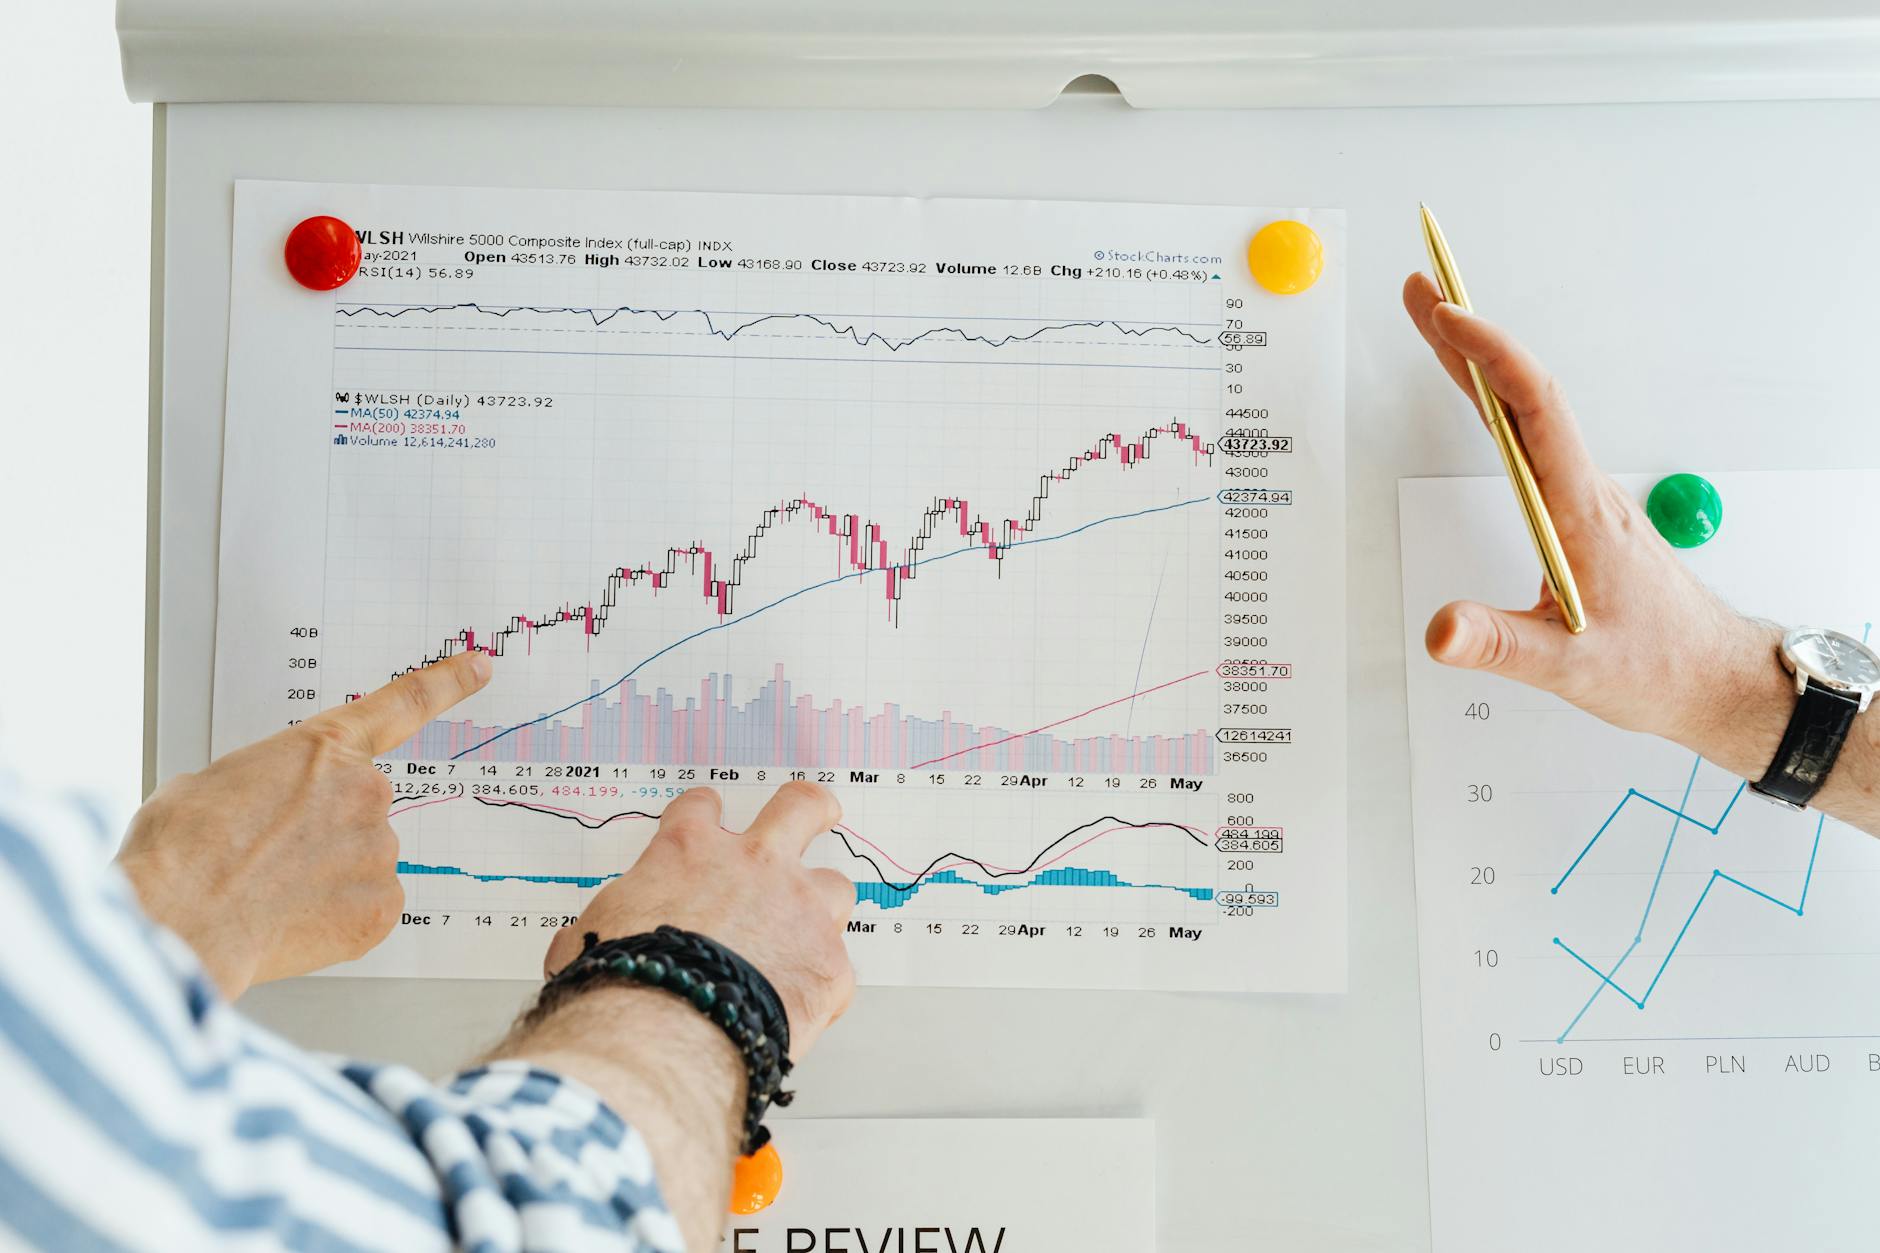
The market’s maturation reached a new level when indexed benchmarks emerged. The PokéViews 100 Index, for example, provides a monthly rebalancing benchmark tracking the top 100 most valuable English Pokémon trading cards with minimum liquidity thresholds. This is conceptually identical to the S&P 500 or Nasdaq: a curated list of assets that serve as a market barometer. When the PokéViews 100 moves up or down, it signals broader Pokémon card market health, not just individual card performance. This benchmarking matters because it shifts conversation from anecdotal (“I sold a Charizard for $12K”) to statistical (“The index is up 8% this quarter, outpacing historical averages”). Index-based thinking attracts institutional or semi-institutional capital. Collectors can now ask, “Am I beating the benchmark?” and adjust their portfolio composition accordingly.
PSA 10 rookie cards, for instance, delivered an 18.3% one-year return, a figure that only becomes meaningful when you can compare it against a benchmark. That return outperformed major equity benchmarks during the same period—data that would be impossible to quantify without structured tracking. The broader market numbers validate this data infrastructure. Pokémon cards have appreciated 3,821% in value since 2004, significantly outpacing the S&P 500’s 483% increase over the same period. But those aggregate numbers are only as credible as the underlying data collection. Without grading records, transaction histories, and real-time pricing feeds, no one could calculate a 3,821% return with any precision. The data infrastructure is what allows that claim to hold weight.
How Collectors Can Leverage Data Tools Without Getting Trapped by Them
For collectors entering this data-driven environment, the tools are genuinely useful but come with a cautionary note. Platforms like PokeDATA, PokemonPriceTracker, ThePriceDex, and PokeTop10 provide real-time intelligence that wasn’t available a decade ago. PokeTop10, for example, tracks sealed product prices, ROI, and market sentiment in real-time for booster boxes, ETBs, and single cards—free analytics that would have cost hundreds of dollars in market research five years ago. That’s a genuine advantage. The tradeoff is that access to data doesn’t guarantee winning timing decisions. PokemonPriceTracker can tell you that a specific card is up 35% in the past three months, but it can’t tell you whether that momentum will continue or reverse. Watching real-time price data can also create decision paralysis.
When you see a card you want priced at $2,100 on Tuesday and $2,040 on Wednesday, the impulse to wait for further drops is strong. Sometimes you’re right; sometimes the card rebounds to $2,300 by Friday and you’ve lost the opportunity. The data democratizes information access, but it doesn’t remove the inherent uncertainty of a speculative market. Serious collectors often use these tools as reference points rather than decision makers. They track cards they own to verify alignment with fair value, they monitor category-level trends (for example, is vintage Base Set demand rising or falling?), and they use historical data to understand whether current prices are reasonable relative to historical averages. That’s operational use of data. Conversely, traders who monitor price movements minute-by-minute and react to every 2-3% fluctuation often underperform because transaction costs (grading fees, shipping, marketplace markups) compound faster than short-term trading gains.
The Data Reliability Question and Sampling Bias in Market Analysis
Not all data in the Pokémon card market is equally reliable. Completed sales on eBay and TCGPlayer are real transactions, which is why platforms like PokeScope prioritize those feeds. Auction house sales are similarly concrete. But asking prices—what sellers are asking for cards that haven’t sold—can distort perception of true market value. A seller might list a PSA 9 Gyarados at $3,500, and that listing gets aggregated into pricing algorithms, even if no one has paid that price in six months. Over time, inflated asking prices can skew benchmarks upward, creating the illusion of market strength when the underlying transactional reality is weaker. Similarly, grading volumes themselves can create bias. When grading submission volumes spike, it often indicates speculative enthusiasm, not fundamental value growth.
A seller who suddenly gets 50 cards graded at once is typically trying to quickly liquidate inventory in a rising market—or speculating on continued gains. The resulting flood of “newly graded” cards in the data feed can overweight recent submissions relative to historical holdings. Markets that rely on transaction volume metrics can be fooled by temporary spikes in submission activity that don’t represent sustained demand. The limitation is especially relevant for investors trying to predict future price movement based on current data. The Pokémon card market has experienced rapid expansion ($450 million in January 2026 alone), but it’s worth recognizing that we don’t have 20-year datasets for most modern cards. Trend analysis based on 3-5 years of data can miss longer-term cycles. The card market could be in a classic speculative bubble phase, in which case the next 12-24 months could see significant corrections. Or it could be in early innings of sustained mainstream adoption. The data available today doesn’t definitively answer that question because the market simply hasn’t provided enough historical evidence.

Sealed Product and Box Lot Tracking—The Newest Data Frontier
As grading became saturated with single-card data, platforms like PokeTop10 extended data infrastructure to sealed product: booster boxes, Elite Trainer Boxes (ETBs), and unopened product sets. Tracking sealed products requires different data architecture because they don’t have individual grades—instead, analysts track acquisition price, market-wide availability, and estimated future ROI based on production volumes and collector demand patterns. The appeal for investors is straightforward: a first edition Base Set booster box that cost $50 retail in 1999 now trades for $400,000+. That’s a 800,000% return.
Newer sealed product, like Scarlet and Violet booster boxes, costs $90-120 retail and the data suggests they’re holding value around $150-200 in secondary markets. Whether that 60-120% markup persists depends entirely on how many boxes were printed, how many collectors want them 10 years from now, and broader economic conditions. Platforms tracking this data help collectors at least understand the baseline: how much sealed product typically appreciates in the first 12 months, how demand varies by set, and which products are becoming harder to find. That empirical knowledge replaces pure guesswork.
The Market’s Future and the Role of Data Infrastructure
Looking forward, the Pokémon card market’s evolution toward data-driven operations appears durable. Market projections show the Pokémon card industry growing from USD 52.1 billion in 2026 to USD 90.2 billion by 2034, representing a compound annual growth rate of 7.1%. That growth trajectory is underpinned by infrastructure: more grading services, more pricing platforms, and more traders building portfolios based on quantitative analysis rather than intuition. The data ecosystem is becoming self-reinforcing.
As the market scales, expect more specialization in analytics tools. Traders will have access to machine-learning price predictions, sentiment analysis of social media mentions, and portfolio optimization algorithms optimized for Pokémon card allocation. The irony is that as data becomes more abundant and accessible, individual advantages from data access shrink. When everyone can see the same price feeds and index performance, alpha generation requires either superior analysis, timing luck, or access to non-public information (like advance knowledge of new set releases). The data-driven market eliminates easy wins but creates structure and transparency that benefits collectors who approach the hobby seriously.
Conclusion
The Pokémon card market is unquestionably becoming more data-driven, driven by professional grading volumes, real-time pricing platforms, and specialized analytics tools that provide unprecedented transparency into transaction history and valuation trends. This shift benefits serious collectors by eliminating information asymmetry and allowing apples-to-apples comparisons across markets and time periods. It also reflects genuine maturation: the market has outgrown informal valuation and moved toward standardized benchmarking, indexed portfolios, and quantifiable performance metrics.
The practical implication is that collectors and investors should embrace the available data tools—PokemonPriceTracker, PokeScope, PokeDATA, and others are genuine resources—while maintaining realistic expectations about what data can tell you. Historical price information and transaction volumes provide context and reduce the risk of egregious overpayment, but they don’t eliminate market timing risk or protect against speculative cycles. The best use of data infrastructure is as a reference framework, not a crystal ball. As the Pokémon card market continues to scale toward $90 billion by 2034, the collectors and investors who leverage data effectively while maintaining disciplined fundamentals will be best positioned to participate in that growth.
You Might Also Like
- Pokémon Card Reselling Is Becoming More Competitive Online
- Pokémon Card Pack Openings Are Becoming Popular Content Again
- Collectors Are Learning To Spot Card Wear