Sales history is the collector’s most reliable tool for determining whether a Pokémon card is overpriced or underpriced in real time. By analyzing completed listings, price trends, and market patterns, you can identify cards selling above their actual market value and negotiate better deals. For example, a Shadowless Base Set Charizard might be listed for $8,000, but if sales history shows similar copies consistently selling for $6,500, you know the asking price is inflated and can either walk away or use that data to negotiate.
Understanding sales history transforms you from a passive buyer into an informed collector who makes strategic purchases. Rather than relying on asking prices—which are often aspirational rather than realistic—you’re grounding your decisions in what people actually paid yesterday and last week. This matters because Pokémon card prices fluctuate significantly based on condition, market sentiment, and supply changes, and sales history captures that movement in ways static price guides cannot.
Table of Contents
- What Does Sales History Tell You About Fair Market Value?
- How to Track Sales Data Across Different Marketplaces
- Using Condition Data to Adjust Your Expectations
- Timing Purchases Based on Seasonal Sales Trends
- Avoiding False Signals in Sales Data
- Comparing Variants and Understanding Why Sales History Varies
- Looking Forward—How Market Data Predicts Future Card Values
- Conclusion
- Frequently Asked Questions
What Does Sales History Tell You About Fair Market Value?
Sales history shows you the actual price at which a card transacted, not what someone hopes to sell it for. When you see a card listed on TCGPlayer, eBay, or other major platforms, that listing is just a starting point. The real market data comes from closed sales—cards that actually sold. These completed transactions represent genuine value because both buyer and seller agreed the price was fair enough to exchange money and goods. The difference between asking price and actual selling price can be dramatic. A card might be listed for $500, but if you check sales history and find the last three copies sold for $350, $365, and $380, you’ve just discovered a 30% gap.
This isn’t unusual in card collecting. Sellers often overprice expecting negotiation, while others simply don’t research what similar cards are fetching. By tracking sales history consistently, you develop an instinct for which prices are realistic and which are wishful thinking. One critical limitation: older sales history (from months or years ago) can be misleading if the card’s market has shifted. A card that sold regularly at $100 last year might command $200 now if it’s become suddenly trendy, or it might have dropped if hype cooled. Recent sales history—from the last 2-4 weeks—is far more predictive than older data.
How to Track Sales Data Across Different Marketplaces
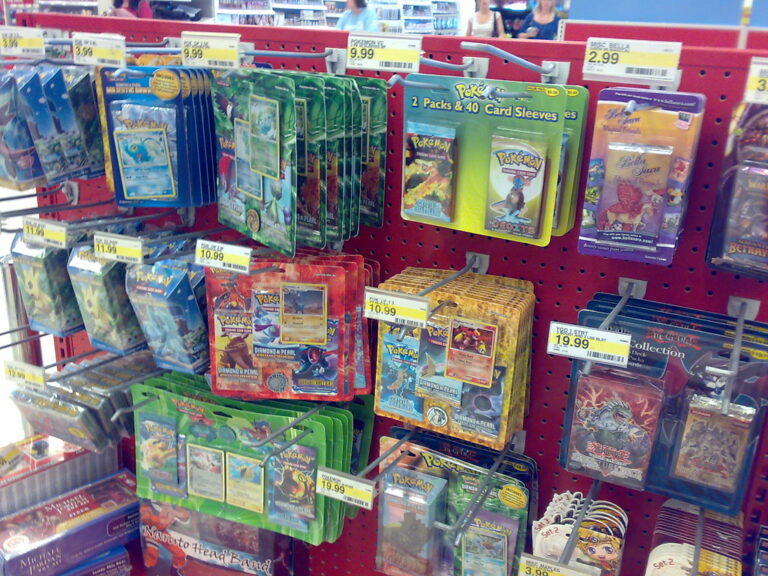
Different platforms present sales history differently, and smart collectors check multiple sources. TCGPlayer’s price history graphs show you the median price over time, which eliminates single outlier sales and gives you the trend line. eBay’s sold listings are searchable and let you see individual transaction prices, condition, and shipping costs. Facebook Marketplace, Reddit’s trading subreddits, and Discord communities show what collectors are actually paying in less formal settings—sometimes with better deals, sometimes with worse ones. The real power comes from combining these sources. You might see on TCGPlayer that Pokémon cards of a certain type have a median price of $150, but checking eBay sold listings reveals that when listings end quickly, prices tend to be 15-20% lower than the median.
this teaches you that urgency affects pricing, and sellers trying to move product quickly often undercut the average. Meanwhile, checking collector communities might show you that similar cards in those groups sell for 10% higher because buyers there trust the seller and expect better authentication. A major warning: be cautious of platform-specific price distortions. eBay sales often include shipping costs, which inflates the final number when you’re comparing to TCGPlayer prices that sometimes list shipping separately. Some platforms show price history only for cards that sold, not cards that were listed but expired unsold—which creates survivorship bias and can skew your perception of what cards actually move. Always factor in condition grades, because a PSA 8 and a PSA 9 of the same card can have a 40-60% price difference.
Using Condition Data to Adjust Your Expectations
Sales history becomes most useful when you cross-reference it with the condition of the actual card you’re considering buying. A Holo Blastoise from Base Set might have sold at $80 several times, but if those sales were for PSA 7 copies and the card you’re looking at is a raw, ungraded card that looks like a PSA 5, you cannot expect to pay $80. Condition is the single biggest price driver in card collecting, and sales history without condition context will lead you astray. Learn to read condition properly. PSA grades run from 1 (poor) to 10 (gem mint), and even one grade level can mean a 15-25% price swing.
When you’re researching sales history, filter for cards with the same grade as the one you’re considering. If you’re looking at an ungraded card, compare it against sales of other ungraded cards in similar condition, or use PSA’s grading guides to estimate what grade it might receive. A card with light wear, clean centering, and minimal creasing might be in the PSA 6-7 range, while heavy play patterns, edge wear, and surface marks suggest a PSA 4-5. One limitation that trips up new collectors: selling an ungraded card based on what a graded copy sold for usually nets you less money. If you think your ungraded card is “basically a PSA 7,” the market will probably value it at PSA 5 or 6 rates because buyers are wary of ungraded cards that look better than they perform when professionally assessed. Sales history of graded cards is useful for ceiling estimates, but always budget conservatively when you’re comparing to ungraded copies.

Timing Purchases Based on Seasonal Sales Trends
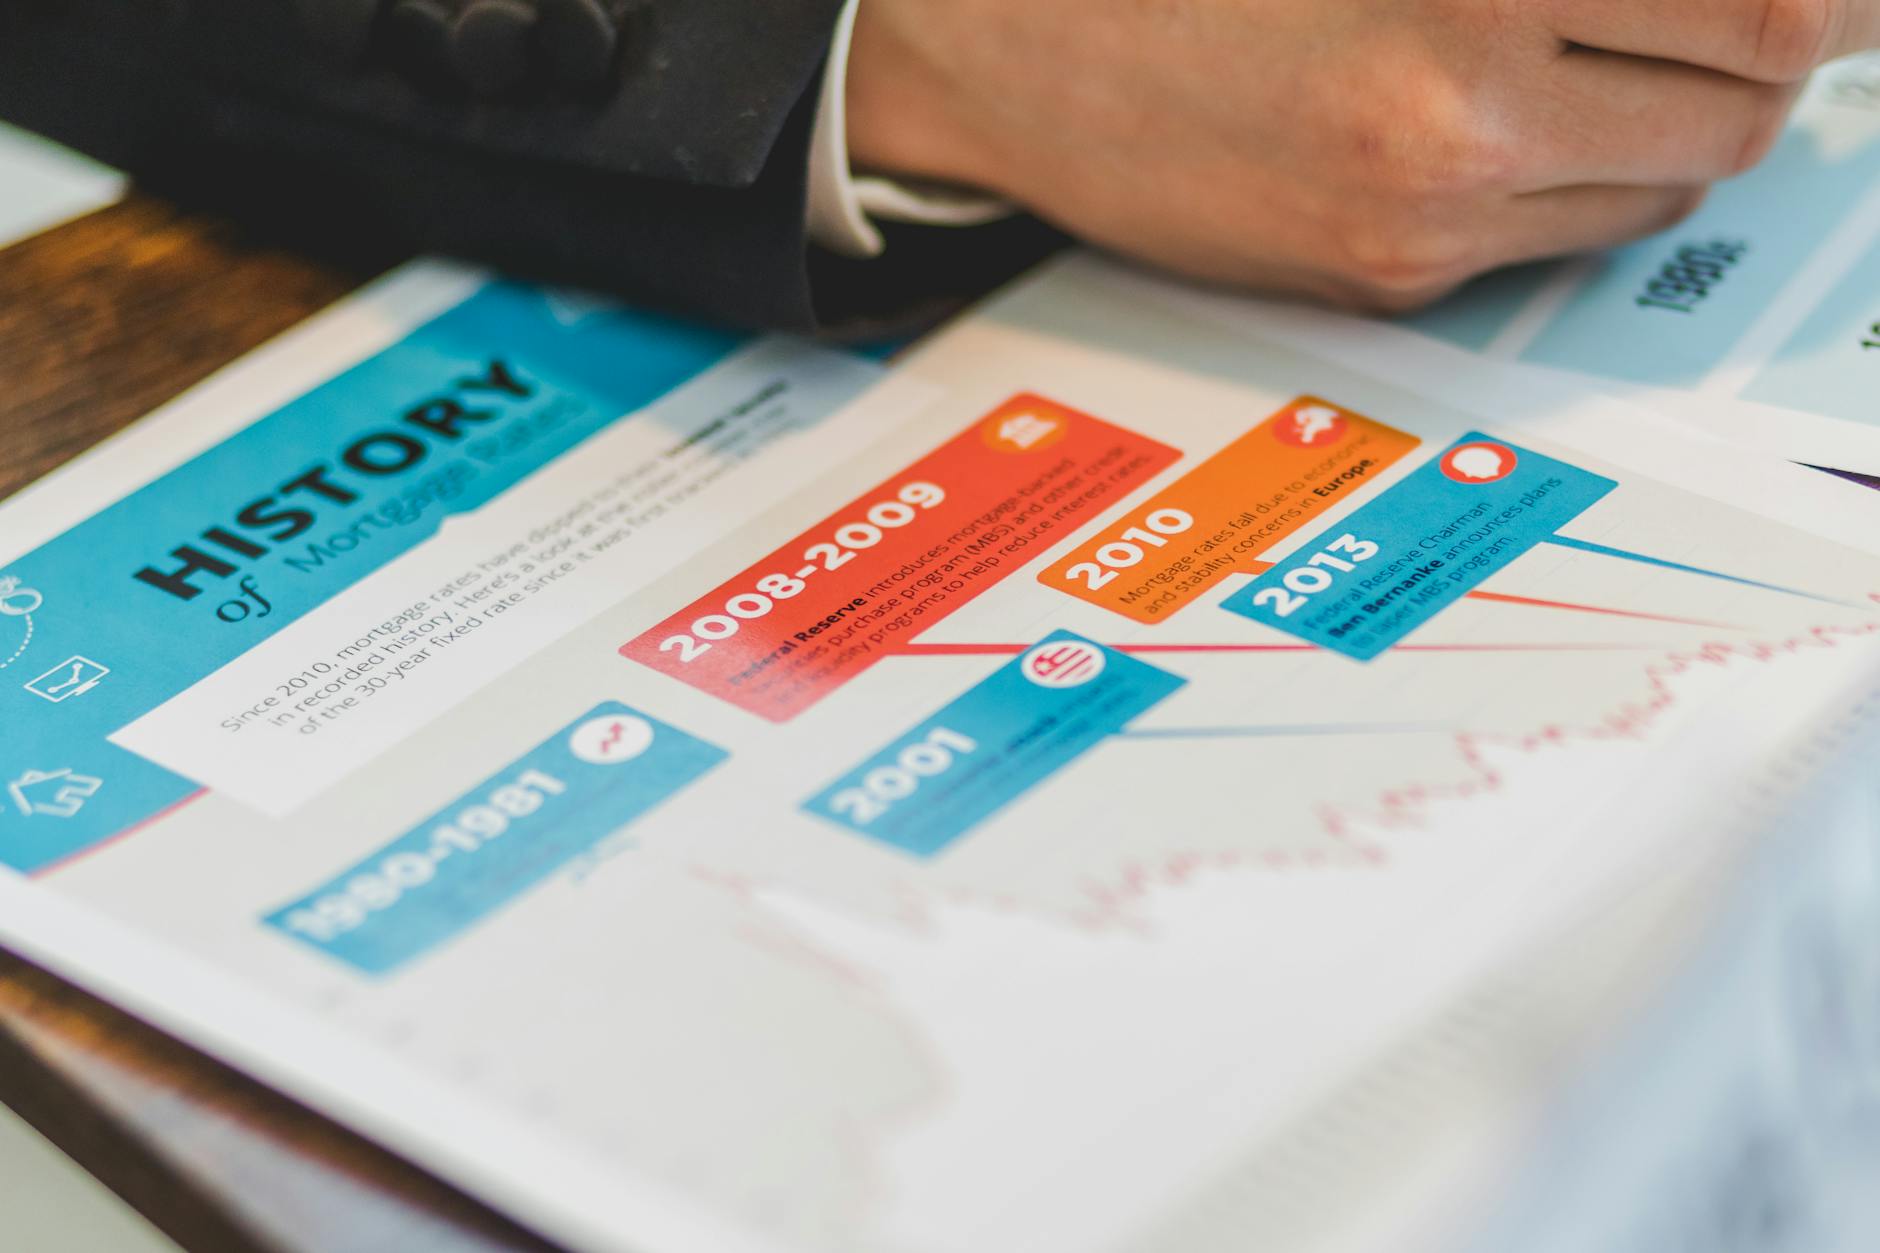
Sales history over months or years reveals seasonal patterns in pricing. Pokémon card prices often drop in late summer and early fall when kids go back to school and parents need money. Prices tend to rise in late October through December as holiday buying begins and collectors have more discretionary spending. January often sees another dip as people deal with post-holiday finances. These aren’t absolute rules, but the pattern shows up clearly in sales data across platforms. You can use this knowledge strategically.
If a card you want has been stable at $300 for the past six weeks, but historical data shows it typically drops 15-20% in August and September, you might wait rather than buy now. Conversely, if you know a card in the hot new set usually spikes in price three months after release, buying at the current lower price and holding for a few months becomes a reasonable strategy. This isn’t speculation on future trends—it’s letting actual historical patterns guide your timing. The tradeoff is that waiting for a better price carries risk. The card might not follow its historical pattern if demand has fundamentally shifted, or supply might tighten unexpectedly and push prices up instead of down. Additionally, condition cards you’re targeting might sell before prices dip. If you spot a card in good condition at a reasonable price with good sales history supporting that price level, waiting for a potential 15% drop in three months means accepting the risk that the exact copy you wanted is gone when the season comes.
Avoiding False Signals in Sales Data
Not all sales history is equally reliable. A single high-price sale of a card might distort your perception—one collector paying a premium for a specific card variant doesn’t mean that price is repeatable. Similarly, a sale that completed very quickly at a low price might be an auction that ended during a slow browsing period rather than indicative of true market value. You need to look at the volume and clustering of sales, not individual outliers. Be aware of “listing inflation,” where the same person or group repeatedly lists a card at an inflated price it never actually sells at, creating the false impression that the card is worth more than it is.
Check whether sales are coming from different sellers or if one person is dominating listings. A card with three sales from three different sellers at $200 each is stronger evidence than a card with 10 listings at $200 where all are from the same dealer and only one has sold. Another red flag: cards that have sharp, unexplained price jumps in their sales history often signal hype rather than fundamental value change. If a card was selling steadily at $80 for six months and then jumped to $300 with three sales in one week, something external likely happened—a popular YouTube video, a celebrity endorsement, news that it’s becoming hard to pull from packs. Sales history will show you that spike, but it won’t tell you if the hype is sustainable. Many collectors who bought at the $300 peak after seeing that spike in sales history later regretted it when prices normalized back to $100-120 within two months.

Comparing Variants and Understanding Why Sales History Varies
Different variants of the same card—shadowless vs. unlimited, first edition vs. unlimited, holographic vs. non-holographic—have completely separate sales histories that should never be mixed. If you’re looking at a Base Set Charizard, its sales history depends heavily on which variant you’re targeting.
A shadowless first edition is in a different universe price-wise than an unlimited non-holo, and comparing their sales histories will give you no useful information. Always verify you’re looking at the right variant before drawing conclusions. This matters for less obvious variants too. A card from different printings, different languages, or different sets might look similar but have vastly different values. Japanese Base Set cards often sell for less than English versions of the same era, but some Japanese variants are actually rarer and command premiums. Sales history for English unlimited will be completely different from Japanese unlimited, even though they’re technically the “same” card.
Looking Forward—How Market Data Predicts Future Card Values
While you can’t predict future prices with certainty, sales history combined with supply information gives you reasonable insight into which cards might hold or increase in value. Cards with consistent, stable sales history over years suggest real, lasting demand. Cards that have climbed steadily in price over multiple years while maintaining decent sales volume likely have genuine interest behind them. Conversely, cards with flat or declining sales history over the long term might be ones to avoid for investment purposes, though they might still have personal collecting value.
The Pokémon card market is cyclical and subject to external trends, but historical patterns ground your expectations. A card that maintains consistent sales at $150 across multiple economic conditions, market hypes, and seasonal changes is likely to remain valuable. The cards to be wary of are those with explosive recent sales history where prices jumped 50% in two months with minimal historical precedent—that’s often hype rather than sustainable value. Use sales history as your guide to consistency, not as a crystal ball for future gains.
Conclusion
Using sales history to buy smarter Pokémon cards means shifting from asking prices to actual transaction prices, tracking trends across platforms, and filtering data by condition and variant specificity. The collectors who make the best purchasing decisions are those who check completed listings before making offers, understand that seasonal patterns exist in their target cards, and recognize which sales data is reliable versus which is distorted by outliers or hype cycles. This approach doesn’t eliminate risk entirely, but it gives you a realistic foundation for what you should actually pay.
Your next step is to establish which platforms show the most reliable sales history for your target cards and check them consistently. Build a personal price tracking habit—when you find a card you want, spend 15 minutes checking what similar copies actually sold for in the last month, and use that data as your negotiation starting point. Over time, you’ll develop an intuition for when a price is a genuine opportunity versus when a seller is testing the market with an inflated ask.
Frequently Asked Questions
How many sales should I review before deciding on a fair price?
Review at least three to five recent sales (from the past 2-4 weeks) from different sellers. One or two sales aren’t enough to establish a trend; they might be outliers. Five to ten sales gives you a strong sense of the realistic range.
Should I only look at completed sales or also consider active listings?
Completed sales are more reliable. Active listings show what people are asking, not what they’ll accept. That said, if a card has been listed unsold for months at a certain price, that tells you the market doesn’t support that asking price.
Does sales history work the same way for vintage cards versus modern cards?
The principle is the same, but modern cards often have much more sales data available because more copies are in circulation and trading hands. Vintage cards with fewer annual sales might show more volatility in their sales history, making trends harder to spot.
Can I use sales history from a year ago for pricing decisions today?
Not reliably for current purchases, but it’s useful for understanding long-term value trends. Always prioritize sales from the last 2-4 weeks for pricing new acquisitions.
What if I find sales history showing a big price range—some copies at $100 and others at $250?
That range usually indicates condition or variant differences. Check the specific grades and variants of those sales. If they’re truly the same variant and condition, the lower sales might be from distressed sellers or quick-moving auctions, while the higher ones might be from strong individual listings.
How much can I negotiate based on sales history?
If sales history shows a card consistently sells at $150 but is listed at $200, you have solid ground to offer $145-155. Most reasonable sellers will acknowledge sales history data and adjust their price. Don’t expect to negotiate aggressively below the established range unless you’re buying multiple cards.